
Applying Mayer's Evidence-Based Multimedia Principles: A Practical Dashboard for Instructional Designers

A cornerstone of Dr. Richard Mayer's cognitive theory of multimedia learning is the idea that using both verbal and visual materials engages multiple channels of the brain's processing capacity, thereby optimizing learning outcomes. You will likely have seen the diagram depicting the two channels (words and pictures) to process information and learning:
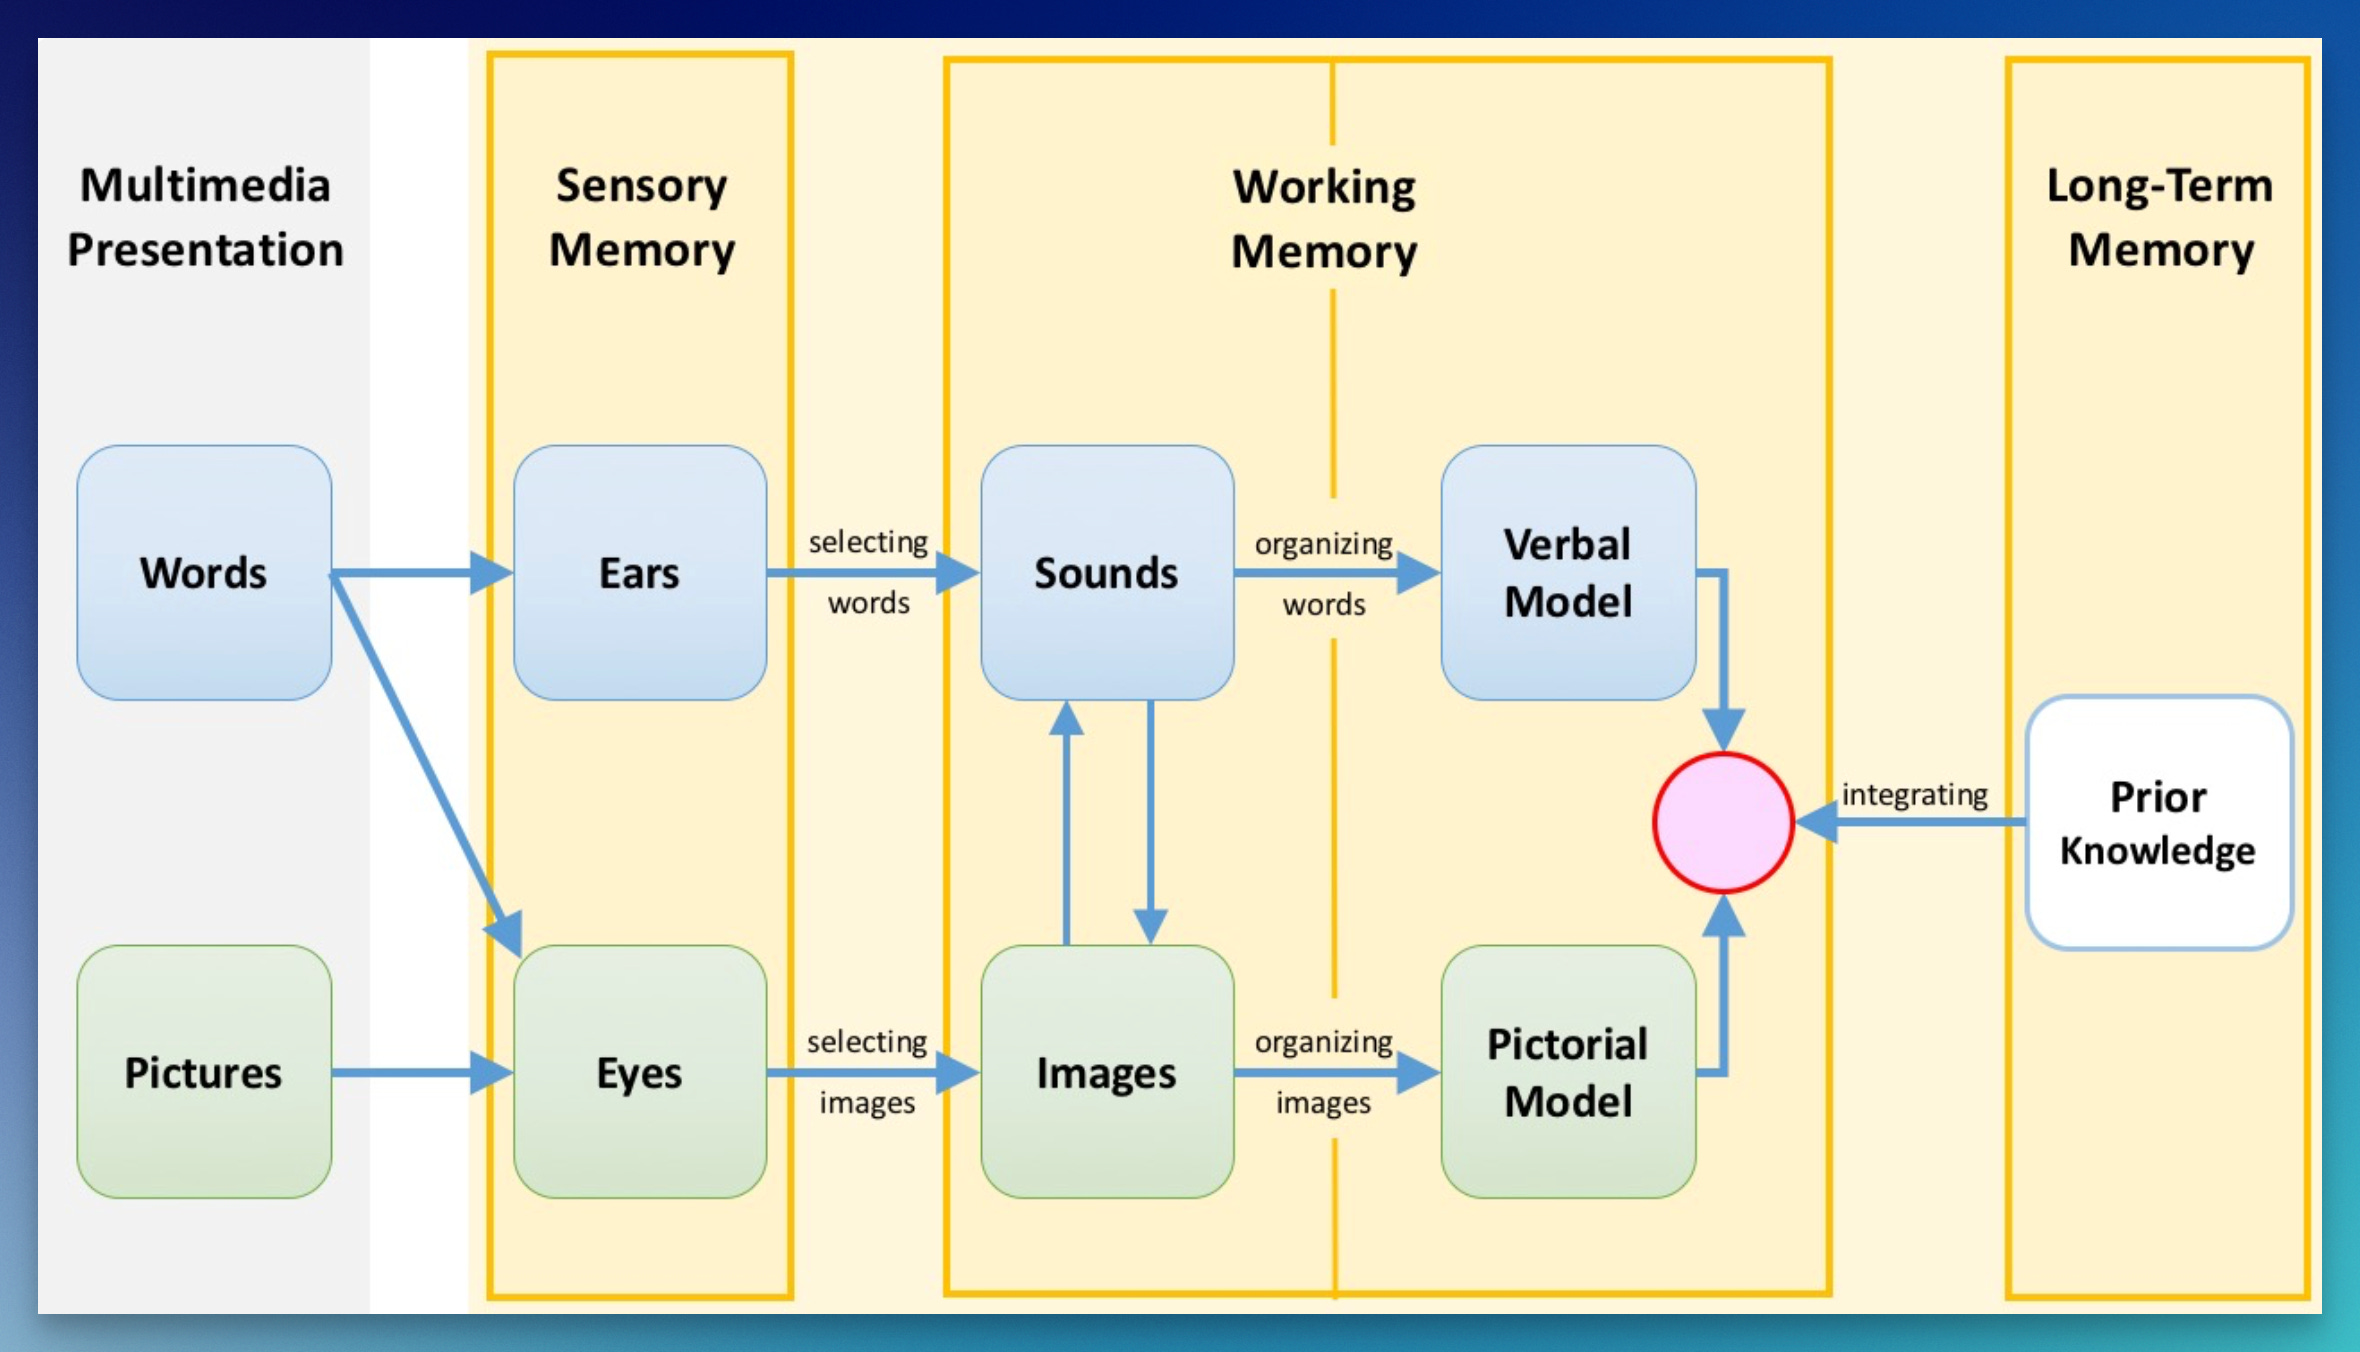
“People learn better from words and pictures than from words alone.” - Richard E. Mayer
I am passionate about exploring the potential of microlearning in today’s digitally connected global communities. Central to this exploration are Dr. Richard Mayer's evidence-based multimedia principles, which are foundational for effective knowledge transfer in multimedia instruction. These principles guide the creation of content that synergistically combines visuals, text or audio in a manner that aligns with learners' cognitive processes. Leveraging these principles, we can significantly enhance learning outcomes in mobile-friendly, bite-sized modules. This approach enables the design of microlearning experiences that are both screen-optimized for mobile devices and effective for deep learning and knowledge transfer. Each module, developed in accordance with these guidelines, stands as a complete unit of learning and forms part of a broader, more integrated educational journey.
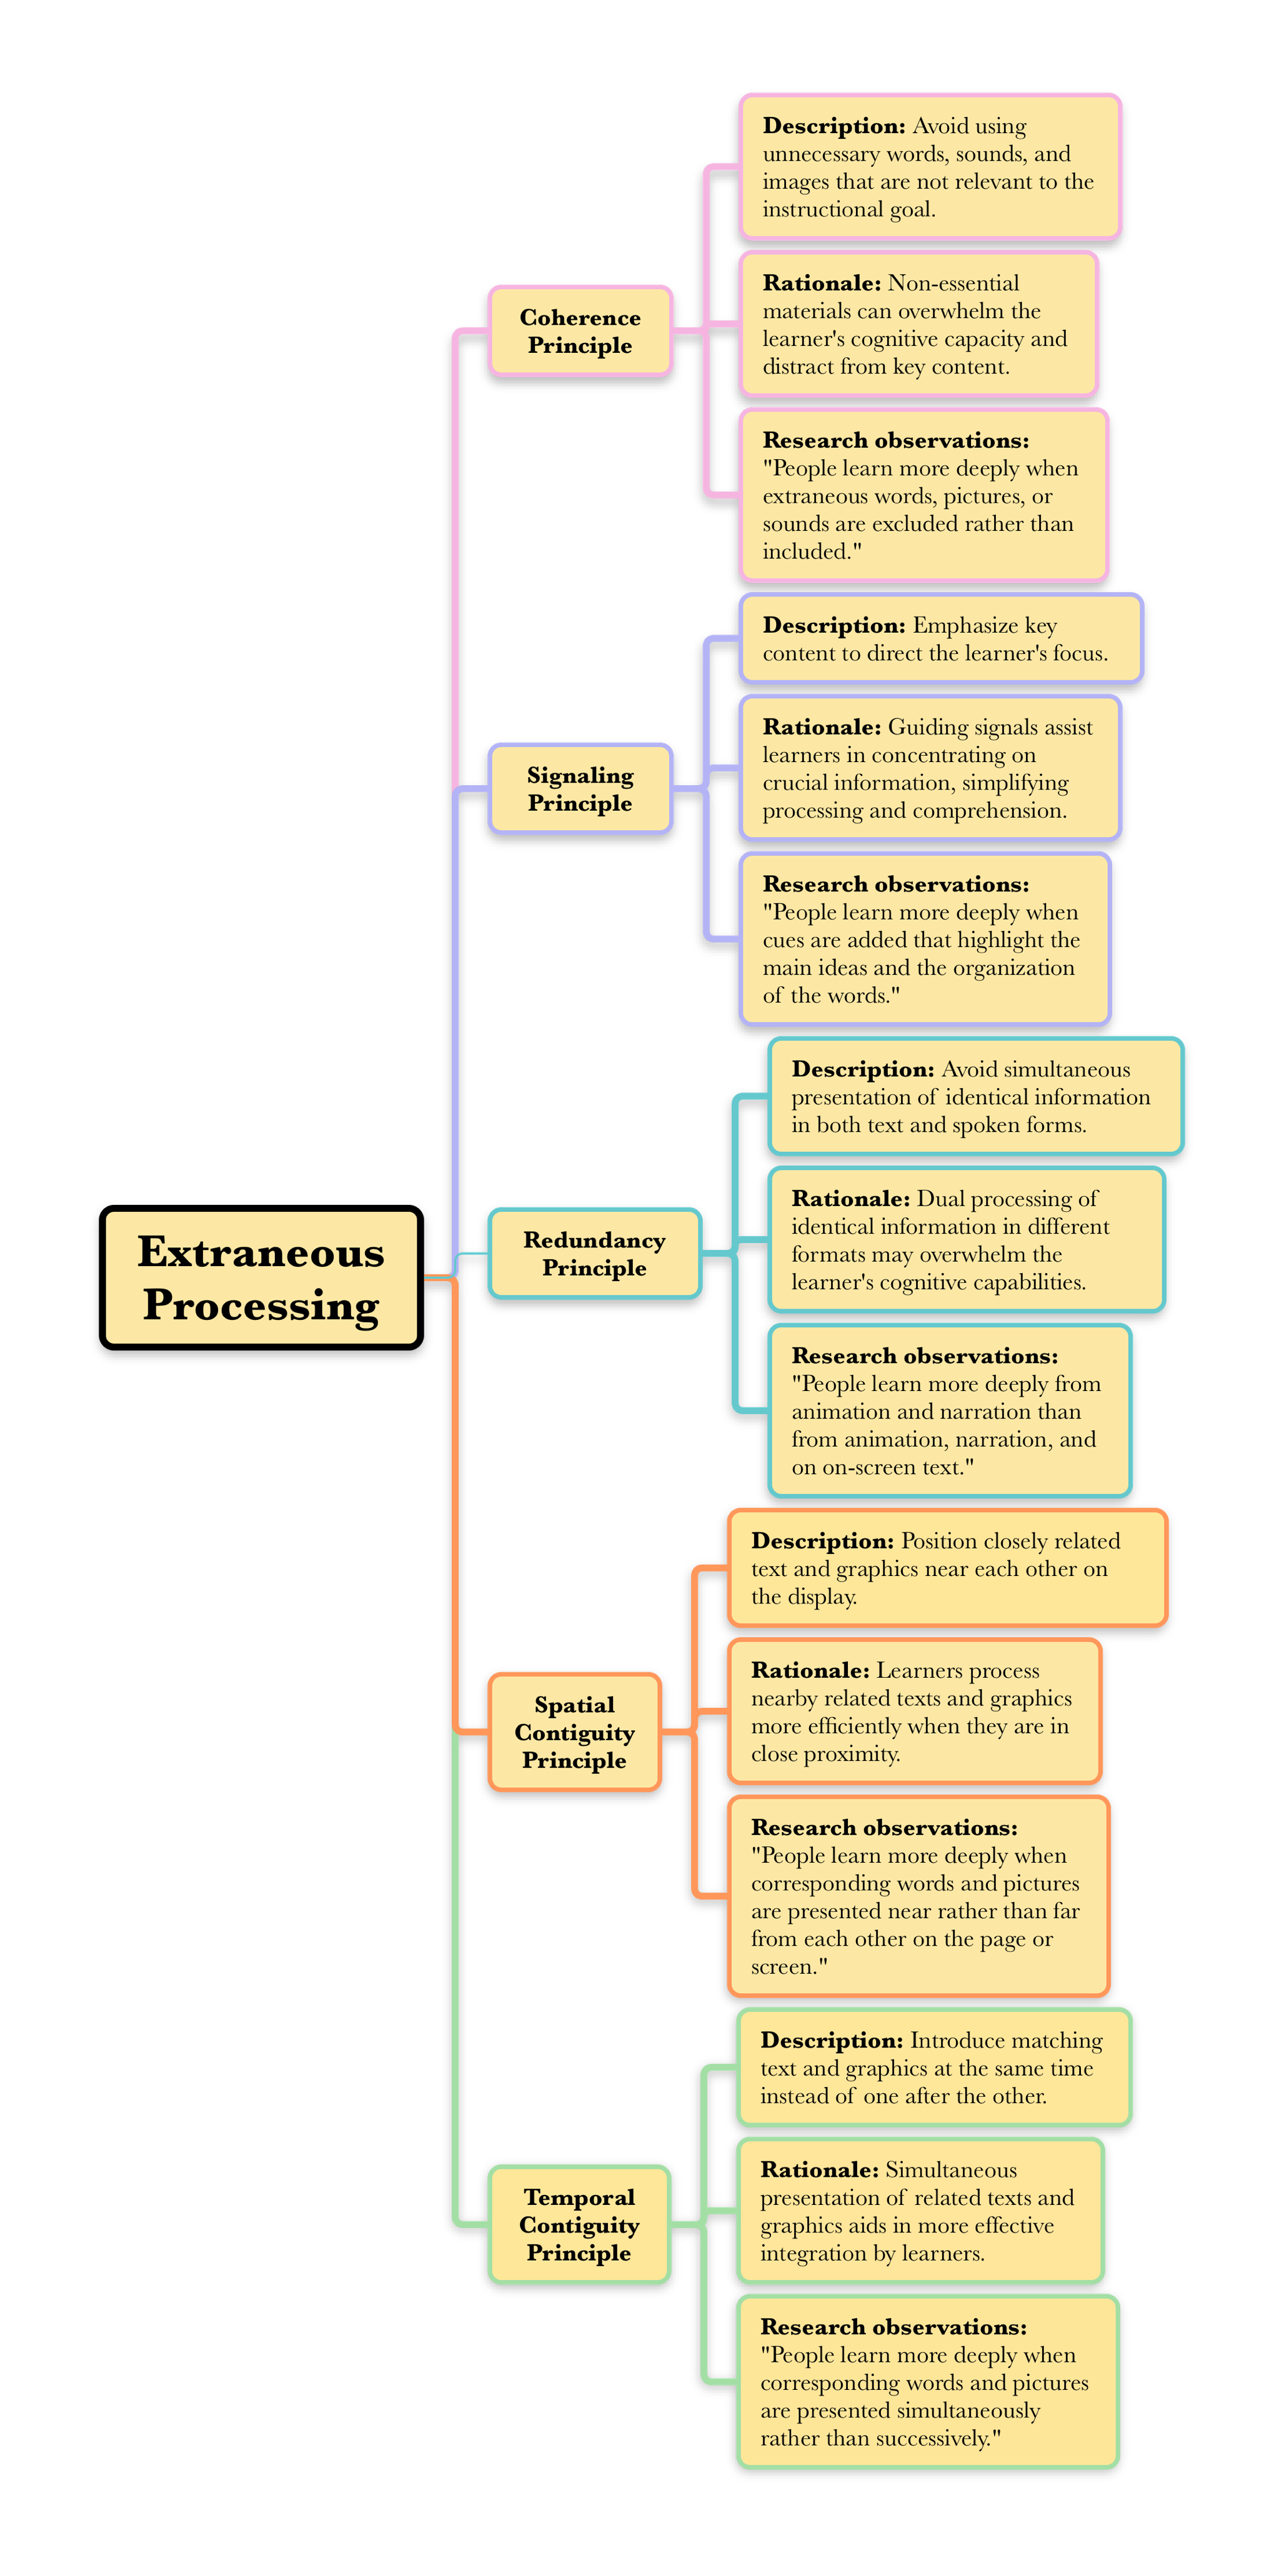
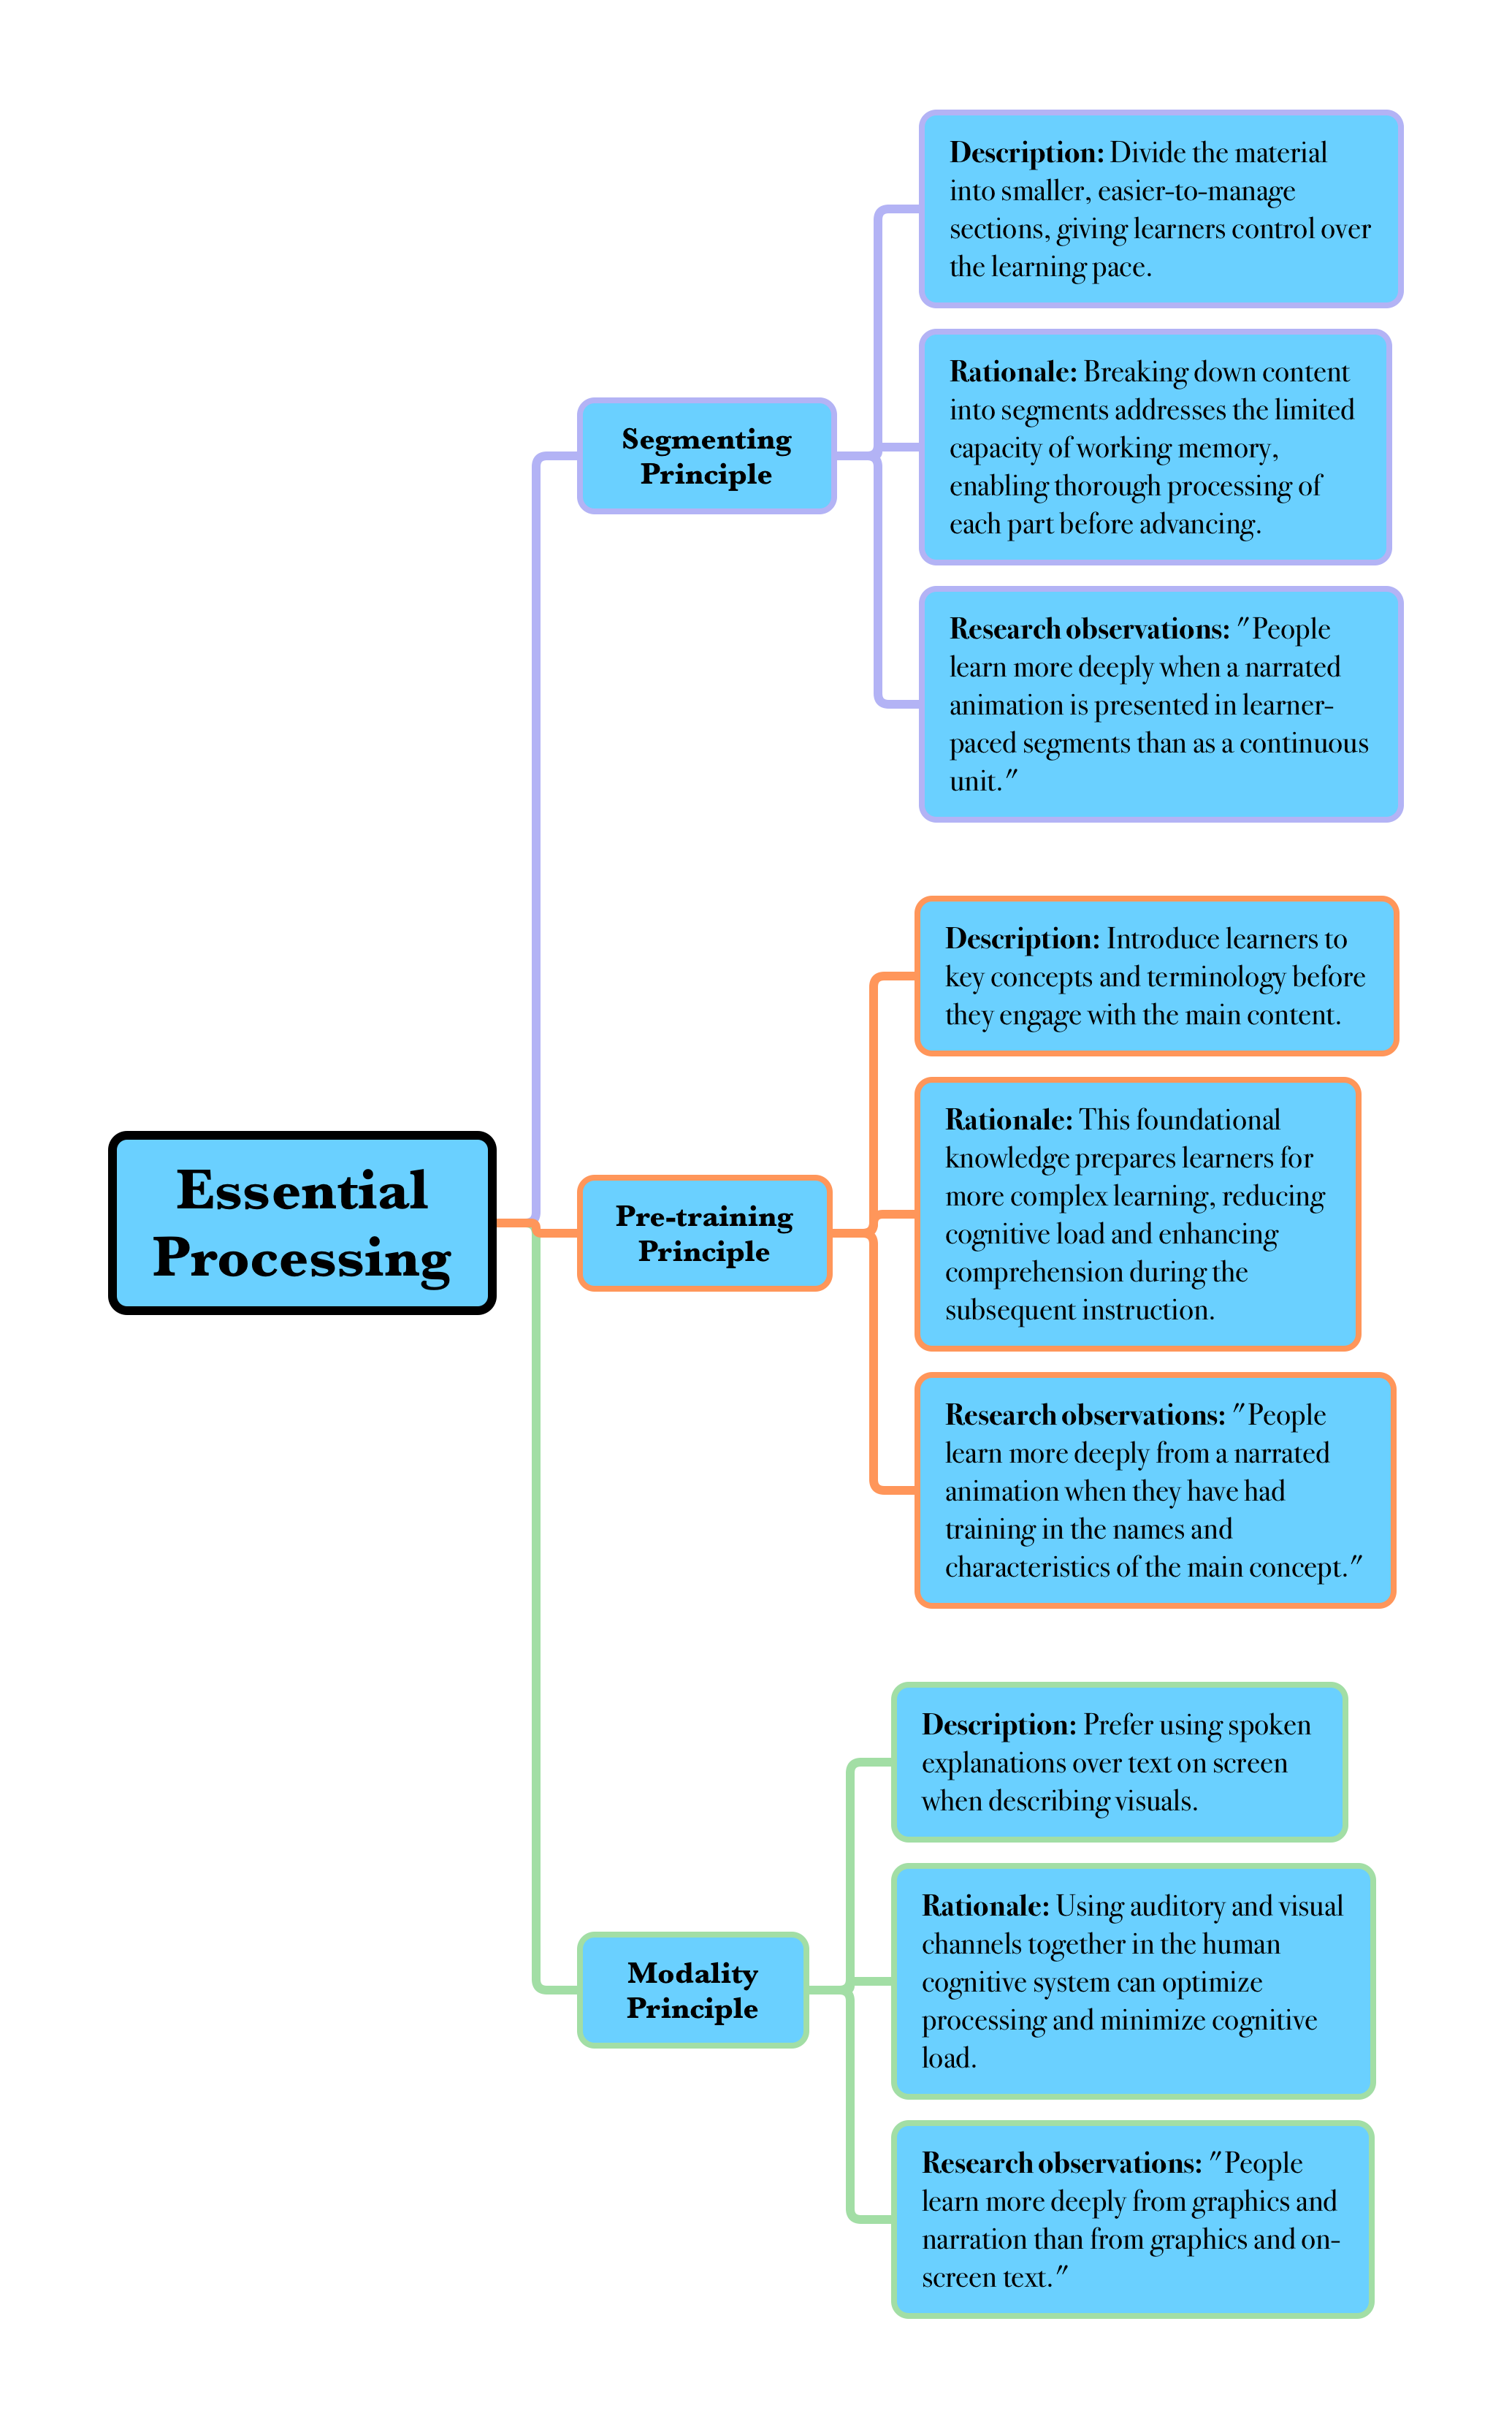
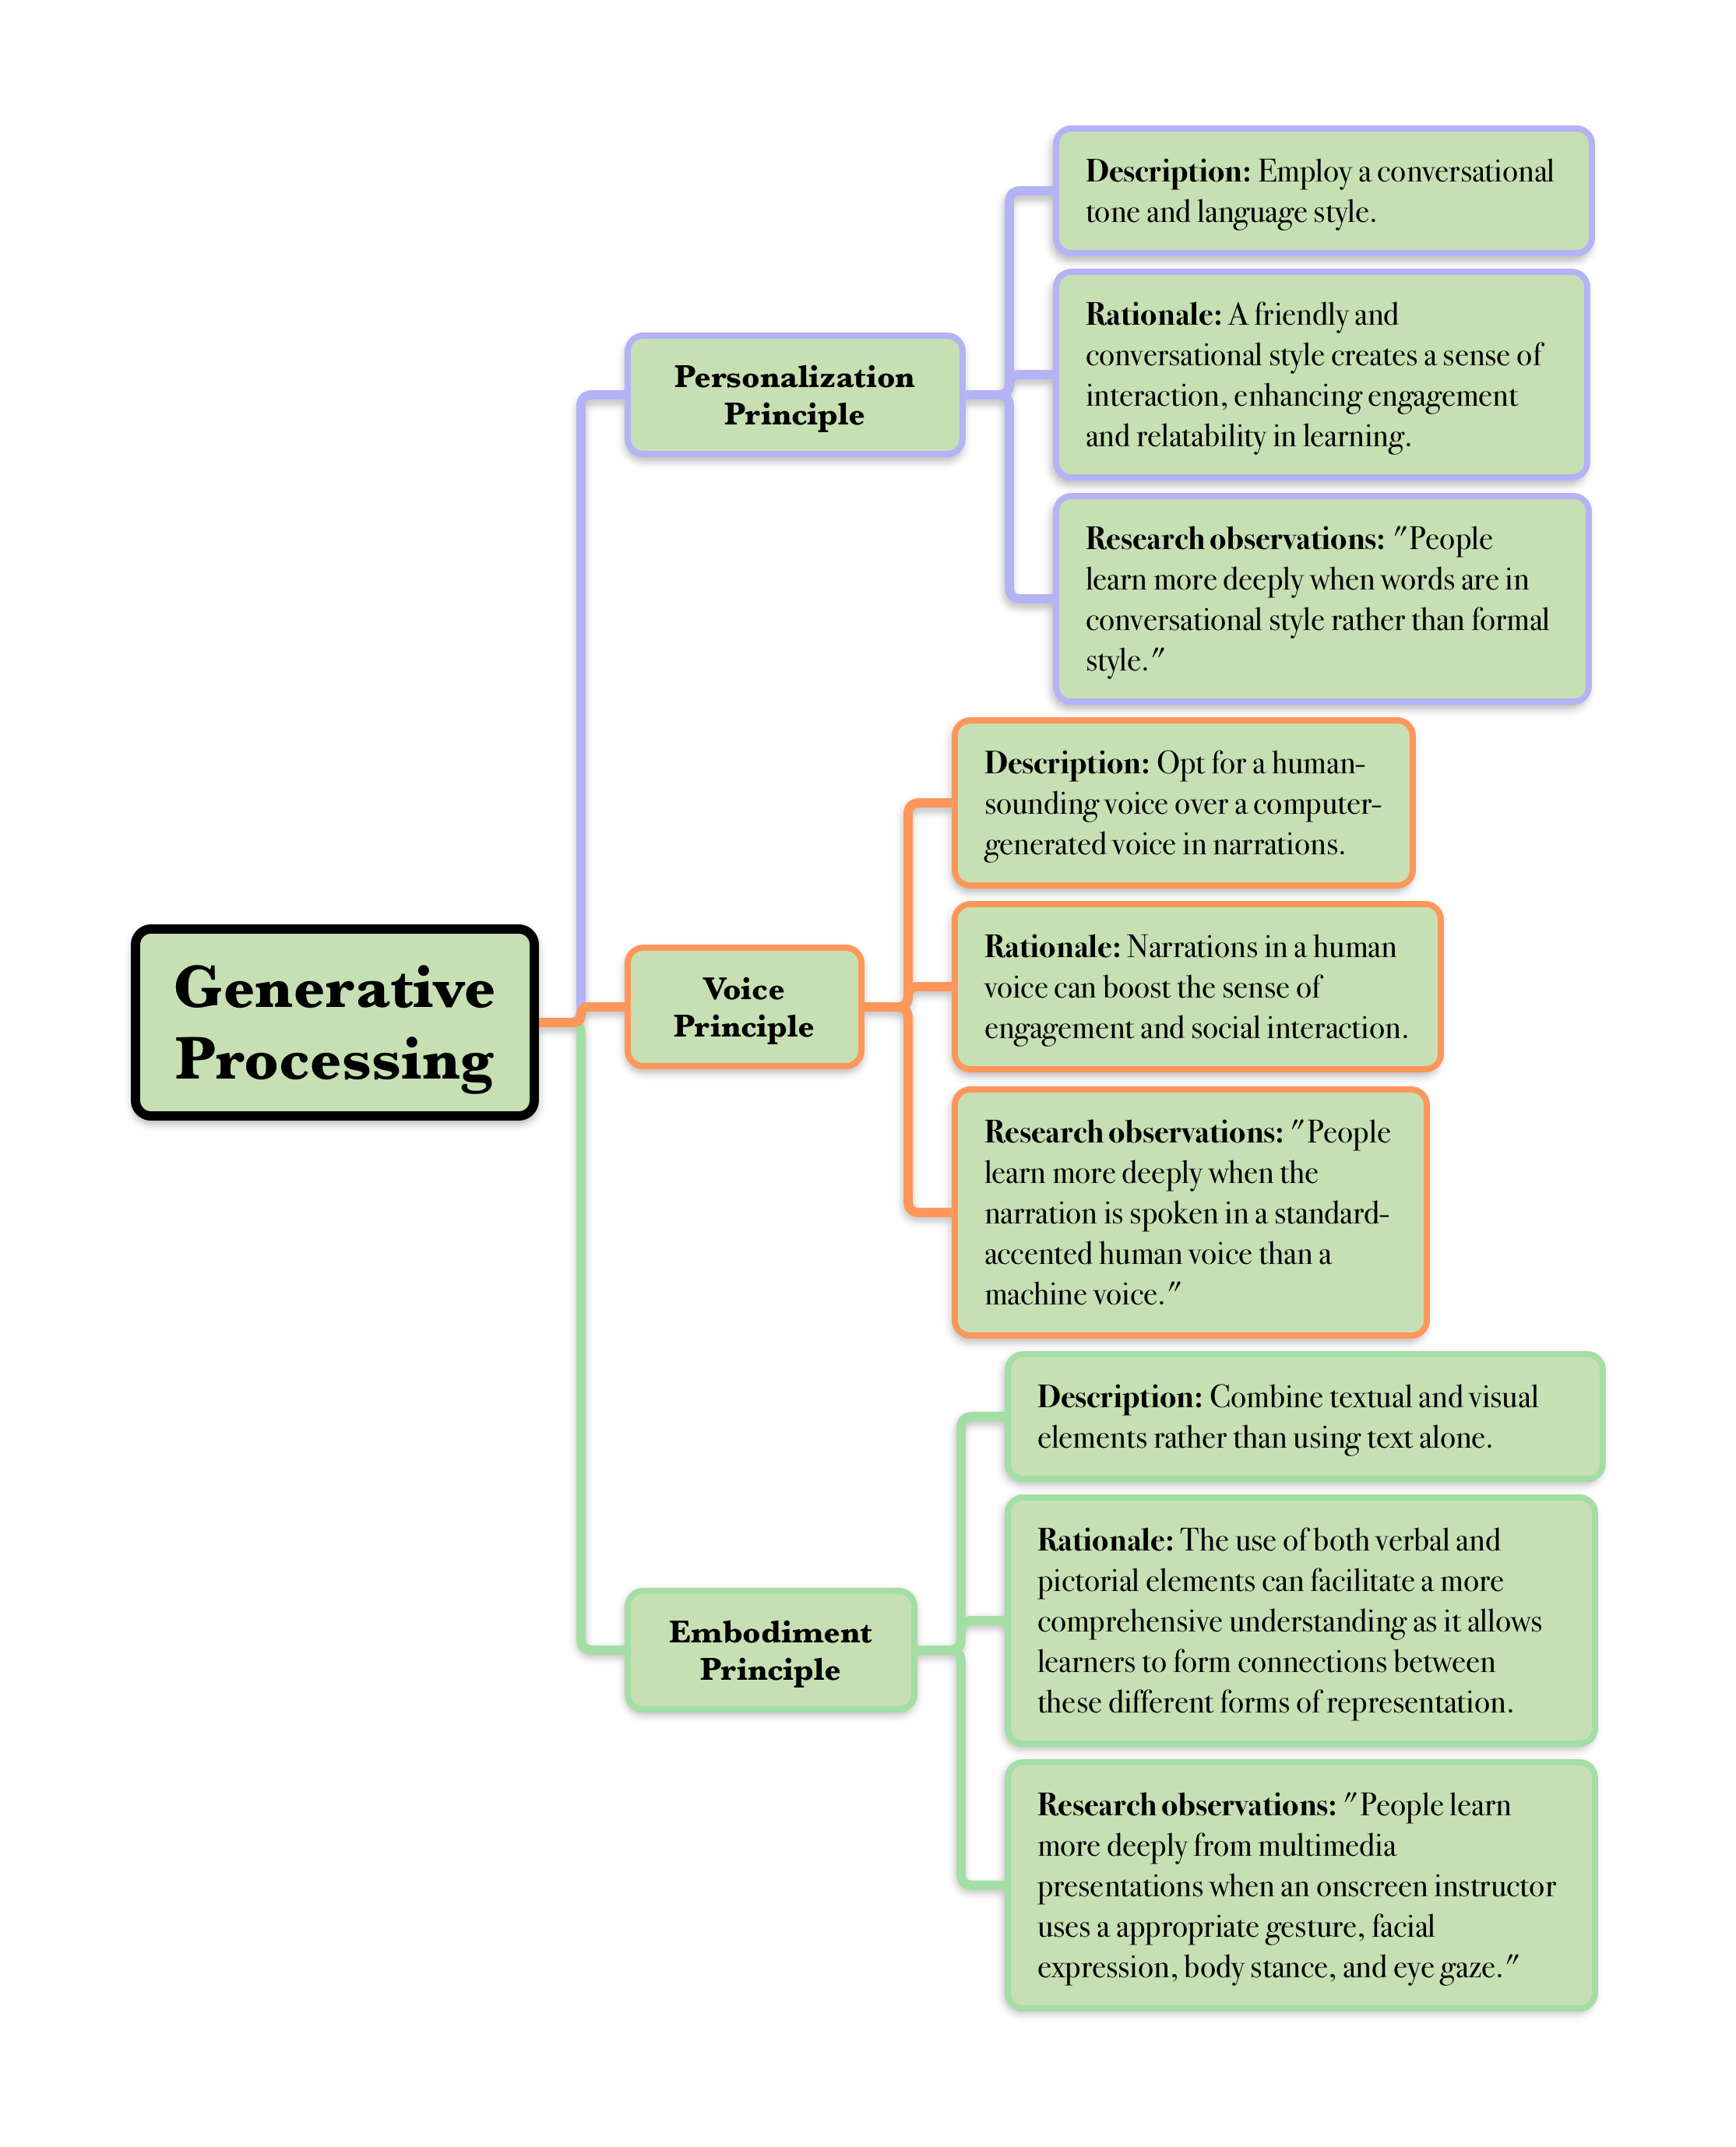
To assist visual learners like me, I've created mind maps describing Mayer's Evidence-Based Multimedia Principles, organizing them into three distinct categories: Extraneous, Essential, and Generative processing.
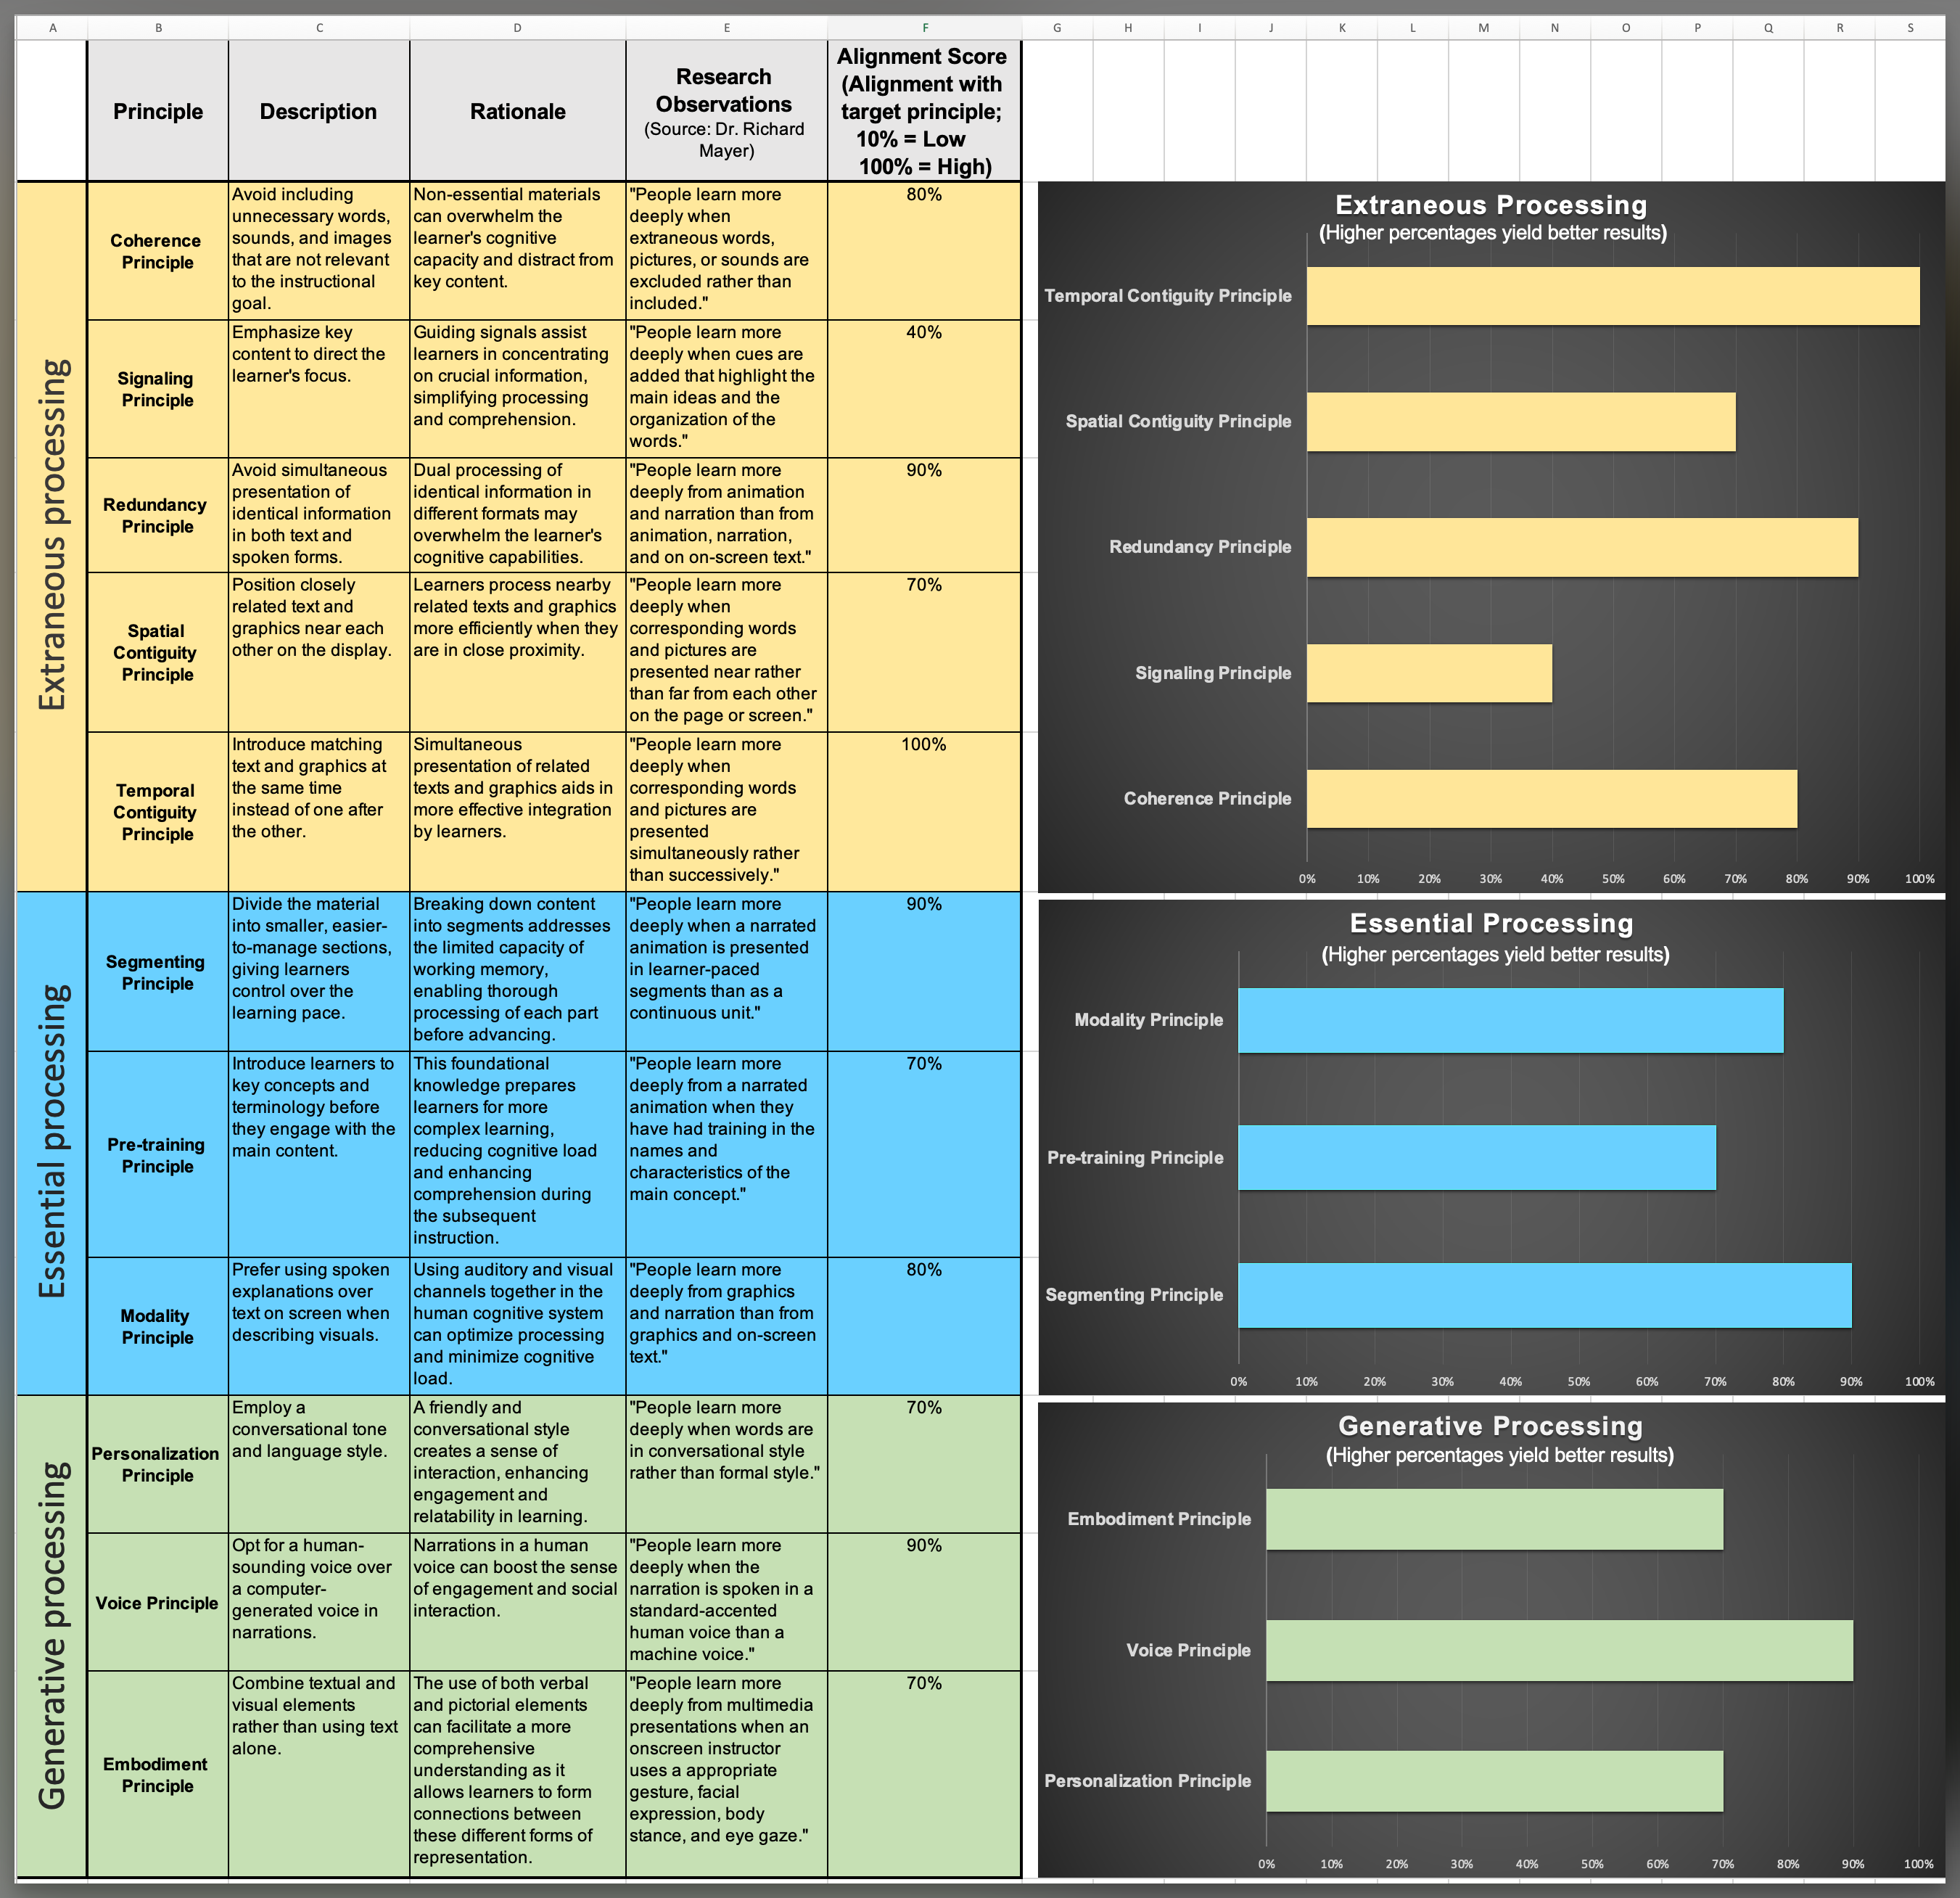
I'm excited to share an Excel dashboard I've put together, tailored to streamline the instructional design process. This dashboard serves as a comprehensive hub for Mayer’s evidence-based multimedia principles, complete with descriptions, underlying reasoning, and their real-world impact. The centerpiece is what I’ve dubbed the "alignment score" — a neat feature I’ve included that lets you gauge how closely your content aligns with Mayer's guidelines. Tinker with the scores in the "Alignment Score" column, say 50%, 70%, or aim high with 100%, and see the charts automatically reflect your changes. For quick assessments, there's a 'Visual Report Snapshot' sheet providing an at-a-glance visual summary of your data. Feel free to make this tool your own – customize it, tweak it, and let it propel you toward that perfect 100% alignment, enhancing learning outcomes as you go.
Just drop me a message, and I'll send over the Excel file to get you started.
References:
Mayer, Richard E. 2009. Multimedia Learning. 2nd ed. New York: Cambridge University Press.
"Pedagogy: Multimedia Learning." Teaching Well Using Technology. Accessed November 28, 2023. https://twut.nd.edu/badges/multLearn.html
Mayer, Richard. "Evidence-Based Principles for Designing Effective Multimedia Instruction." YouTube video, 1:28:40. Posted by "Johns Hopkins School of Education," January 4, 2022.